The concept of the all-weather portfolio was developed by Ray Dalio. The mythical beginnings of this strategy start with President Nixon taking the U.S. off the gold standard and makes for compelling reading.
We continuously ask ourselves the question at the heart of the all-weather portfolio (albeit with a real estate focused twist): How does a real estate investor develop an all-weather strategy?
Is it even possible in an illiquid asset class that is prone to swings in valuations?
We don’t have a straight-forward answer. But we wanted to reveal our thought processes and the core considerations required to develop a coherent framework around this pressing question.
In this post we will discuss the concepts of the investing personality and risk-adjusted returns. These are two essential components of developing a rock-solid, all-weather portfolio.
In our portfolio analysis we are exclusively considering private real estate assets. Why?
- We can offer more actionable advice by narrowing our focus.
- Income producing assets are recession resistant and provide an anchor during economic downturns.
- Lower perceived volatility (private assets do not get marked-to-market daily) which leads to reduced panic buying/selling during market turmoil.
The last point – perceived volatility – is very important. It is straight out of the behavioral economics playbook.
Investors can develop effective long-term, wealth-building strategies by understanding how they will act as opposed to how they should act.
Investing Personality
Discipline and consistency are the twin hallmarks of successful investors.
Conventional wisdom makes us believe that IQ is the best predictor of success. But that is not the case. In fact, Warren Buffett has long said that IQ isn’t the single defining factor to being successful.
The idea sounds simple: combine discipline and consistency. But it is very hard to do.
Unparalleled winning streaks, that fly in the face of mean reversion and the efficient market hypothesis, are produced by marrying discipline and consistency, with ample doses of emotional stability.
Discipline requires a strict adherence to a strategic plan. This requires a thorough understanding of one’s personality, underlying goals (financial and non-financial) and objectives.
“One can have no smaller or greater mastery than mastery of oneself” – Leonardo da Vinci
A key starting point on the investment journey then is understanding one’s investing personality. This isn’t a standard finance term. But we use it to summarize the considerations that drive investors when making portfolio allocations.
The CFA program goes in depth into this concept in the form of an investment policy statement (IPS).
- What are the short-, intermediate- and long-term goals?
- What is the ideal asset allocation?
- What are ongoing and retirement requirements from the portfolio?
- Are there sufficient liquidity reserves for major life events (first home purchase, college tuition, marriage)?
- What is the investor’s risk tolerance?
- This covers an investor’s willingness and ability to take risks. These are often at odds with one another.
- How much of the capital is the investor willing to lose?
- How does an investor respond to fluctuations in portfolio valuations?
- Will an investor remain committed to the asset allocation during tough market conditions?
- How much time, energy and effort is the investor willing to forgo – delayed gratification – to achieve their investing goals?
- Does an investor want to be active or passive?
- Are they comfortable with a 3rd party managing their portfolio?
- How much control are they willing to cede to their investment manager?
Successful and experienced investors have developed a deep understanding of their investing personality. They leverage it for maximum effect by only staying within their circle of competence.
We recommend investors treat this as a semi-annual or annual exercise.
This is akin to taking one’s car to the mechanic for regular maintenance. Or as the saying goes, “a stitch in time, saves nine.”
In our experience, it is critical to write and rewrite answers. The mere act of writing has been proven to force the writer to systematically organize their thoughts. It also allows one to avoid hindsight bias by objectively assessing events.
Ultimately, the overarching mission is to develop a set of repeatable systems and processes. This enables an investor to efficiently filter and quickly pounce on the right opportunity that matches their goals and risk appetite.
We find this is especially true for novice investors. Unlike public securities, investing in private real estate assets requires deeper due diligence and patience. This process is doubly frustrating when capital is waiting to be deployed.
Remember, the journey is as important as the end result.
The illiquid nature and higher barriers to entry (in the form of larger outlay of capital) also result in a greater opportunity cost.
E.g. an investment in a publicly traded stock can be quickly sold with limited loss of capital. This is not an ideal situation but the investor is not “locked in” to a sub-optimal investing decisions.
An investment in a syndication on the other hand, likely requires a minimum investment ($50-100K) and can not be easily liquidated.
The former constraint is to ensure that it is worth the sponsor’s time and effort to work with an investor. Smaller pools of capital are inherently inefficient. This can eat into the time the sponsor could have devoted to making the asset operationally efficient.
The latter constraint is due to the nature of the asset class. The investor either has to wait for a significant portion of time before being allowed to liquidate their position if they make a sub-optimal investing decision.
Since, the real world isn’t a case study in business school nobody gets a complete basket of opportunities with risks and returns presented in advance for an easy side-by-side comparison.
The average investor has capital and time constraints. There is an opportunity cost to every decision. The smaller the capital pool, the more apparent these drivers. Investors get more leeway with a bigger capital pool as it comes with less restrictions and more options.
As the capital pool grows, the focus shifts from capital accumulation to capital preservation. Therefore, finding the right opportunities and matching them with the investor’s personality at the right time is critical in establishing an all-weather portfolio.
An abundance of behavioral finance research has proven that humans consistently make irrational investing decisions. As such, it would behove an investor to restrict the number of decisions to be made when choosing what and where to invest.
Having an honest and complete understanding of one’s investing personality helps one to form their investing strategy, develop their goals and finally stick to these through good and bad times. Thereby demonstrating the hallmarks of success – discipline and consistency.
Risk-Adjusted Returns and the Fallacy of Chasing IRR
We often hear investor say, “I don’t look at deals with less than 18% IRR” or something similar.
It has become standard practice, especially for new investors, to go down this path. This is the wrong approach.
The gurus all tell you the same thing: pick a return, analyze deals, only look at deals that meet the minimum return criteria.
This results in hordes of investors buying Class D properties and regretting it for the rest of their lives.
We know that a 15% return in a Class B area is better than the same return in a Class D area.
Why?
Intuitively, we understand that higher class areas carry less risk. Ceteris paribus, an investor should take less risk for the same income.
Therefore, one must understand the risk and return interplay or risk-adjusted returns before making purchase decisions.
In commercial real estate, risk assessment is based on a judgement call on perceived risks. It’s subjective and depends on the individual’s tolerance for the various types of risks within a deal. Hence, it is critical for the investor to understand their investing personality.
The first step in understanding risk-adjusted returns begin with understanding the concept of risk-fee return. This is the theoretical rate of return for zero risk. Obviously, in the real world, there is no such thing as zero risk. But sophisticated investors use the U.S. Treasuries as a proxy for the risk-free return.
We should assign a holding period to put this into perspective. On average, real estate is owned between 3-7 years. We can look at the current U.S. Treasury yields over the same maturity dates (as of July 3, 2018) which range between 2.65% and 2.83%, for 3 and 7 years respectively.
A reasonable starting point would be to take the midpoint of this range and assume the risk-free rate at 2.74%.
Based off our risk-free rate, every percentage point of risk beyond 2.74% annual returns incurs risk. In other words, we can graph this relationship like:
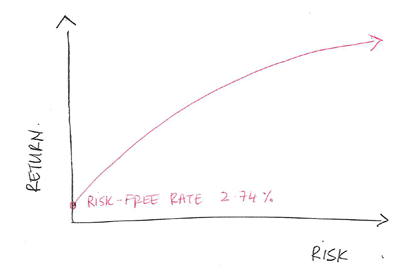
As we can see, stepping out onto the risk curve generally has a correlation with higher return.
Each incremental step further out on the risk curve should produce a corresponding increase in return.
In other words, low-risk, unleveraged, Class B multifamily in a growing sub-market in Dallas is a lower risk (and lower potential return potential) than a highly leveraged Class C asset in a declining market in the Midwest.
Another way to interpret this is to assume that the red line or “fair value” line has the optimal mix of risk and return.
From the perspective of returns (below), the superior investment offers the same return but with lower risk.
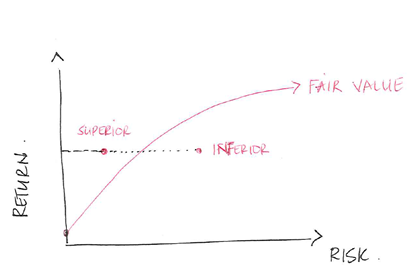
This can also be expressed from the perspective of risk. For the same level of risk, the superior investment offers a higher return.
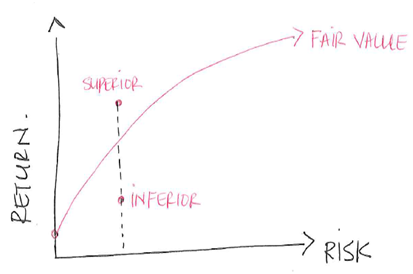
Who would take on additional risk for the same return? Or lower returns for the same risk?
NOBODY!
Intuitively, we can grasp the risk/return scenarios described above.
Understanding returns is, relatively, easy. But understanding the risk side of the equation requires finesse and sophistication. Essentially, an investor must create a “stack” of elements to estimate risk.
Before estimating risk, an investor must have a basic understanding of risk. This involves understanding the most common due diligence mistakes and sources of risk in real estate investment deals.
Crowdstreet provides an excellent example of the stack that I referred in the paragraph above. I have used their examples and edited it for clarity.
| Retail Investment | Multifamily Investment | Retail Score | Multifamily Score | Notes | |
| Asset Type | Grocery-anchored retail shopping center | Multifamily building | 4 | 7 | Investor prefers multifamily due to earlier investment experience |
| Sponsor Experience | Seasoned – 8 years within asset class and sub-market | Tenured – 20 years within asset and sub-market | 2 | 6 | 20 years > 8 years |
| Target IRR | 14% | 16% | 3 | 5 | 16% > 14% |
| Target Holding Period | 5 years | 5 years | Draw | ||
| Occupancy | 95% | 90% | 5 | 4 | Higher occupancy is better |
| Tenant Profile | Grocery-anchor is credit tenant (10 years); remaining mom-and-pops, average lease term 4 years | Multi-tenant; no tenant occupies has a lease over 13 months; most are MoM | 7 | 4 | Anchor tenant on 10 years limits leasing risk |
| Vintage | 2008 | 1990 | 5 | 3 | Newer building = less capex issues |
| Market | Primary – urban | Secondary – suburban | 4 | 6 | Suburban market is less risky due to better demographics |
| Leverage | 65 LTV | 70 LTV | 3 | 5 | Potential for higher leveraged returns |
| Total Risk Score | 33 | 40 |
We have compared two competing assets and ranked each attribute on a 1-10 scale. The number assigned to each category is aggregated into a total risk score.
Although this is a simple example, it provides insight into a basic ranking methodology an investor can use to compare two real estate investments.
The point being that it is possible to quantify risk once an investor has opinions on how to rate individual risk attributes/factors.
With comparative risk scores and known targeted IRRs, we can plot the details against each other.
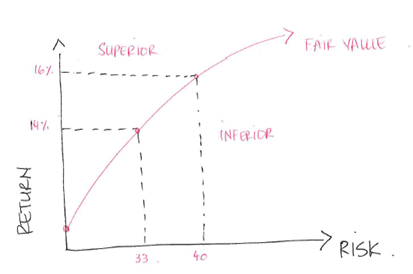
Based on the graph above, the plot suggests that the multifamily investment provides a better risk-adjusted return, given the preferences of the investor in the example.
This is supported by the notion that to receive an additional 14% of annual return (14% to 16%) an investor must incur an additional 21% risk score (33 to 40).
Provided the investor is comfortable with the weighting and score of each factor, they now have a quantifiable basis to claim that the proposed retail investment incurs too much relative risk for the return.
The above example provides a basic framework on how investors can compare between competing real estate investments.
Ideally, one is looking for a real estate investment that offers a higher return for the same amount of risk or same returns for lower risk.
This follows modern portfolio management theory. Just as an investor wouldn’t load up their stock portfolio with only high risk, speculative companies, similarly an investors wouldn’t follow the same path in real estate.
Unfortunately, with the real estate market only going up for almost 10 years, people have a feeling that all real estate is the same.
The reality is that total projected returns are meaningless if not adjusted for risk.
Or as Warren Buffet would say, “Don’t confuse luck with skill.”
This post was co-authored by financial strategist Omar Khan and Andrew Landram.